Raspberry Pi Debug Probe
About the Debug Probe
The Raspberry Pi Debug Probe is a USB device that provides both a UART serial port and a standard Arm Serial Wire Debug (SWD) interface. The probe is designed for easy, solderless, plug-and-play debugging. It has the following features:
-
USB to ARM Serial Wire Debug (SWD) port
-
USB to UART bridge
-
Compatible with the CMSIS-DAP standard
-
Works with OpenOCD and other tools supporting CMSIS-DAP
-
Open source, easily upgradeable firmware
|
Note
|
For more information on the Raspberry Pi three-pin debug connector see the specification. |
This makes it easy to use a Raspberry Pi Pico on platforms such as Windows, macOS, and Linux that lack a GPIO header to connect directly to the Pico’s serial UART or SWD port.
The Debug Probe
The probe operates at 3.3V nominal I/O voltage.
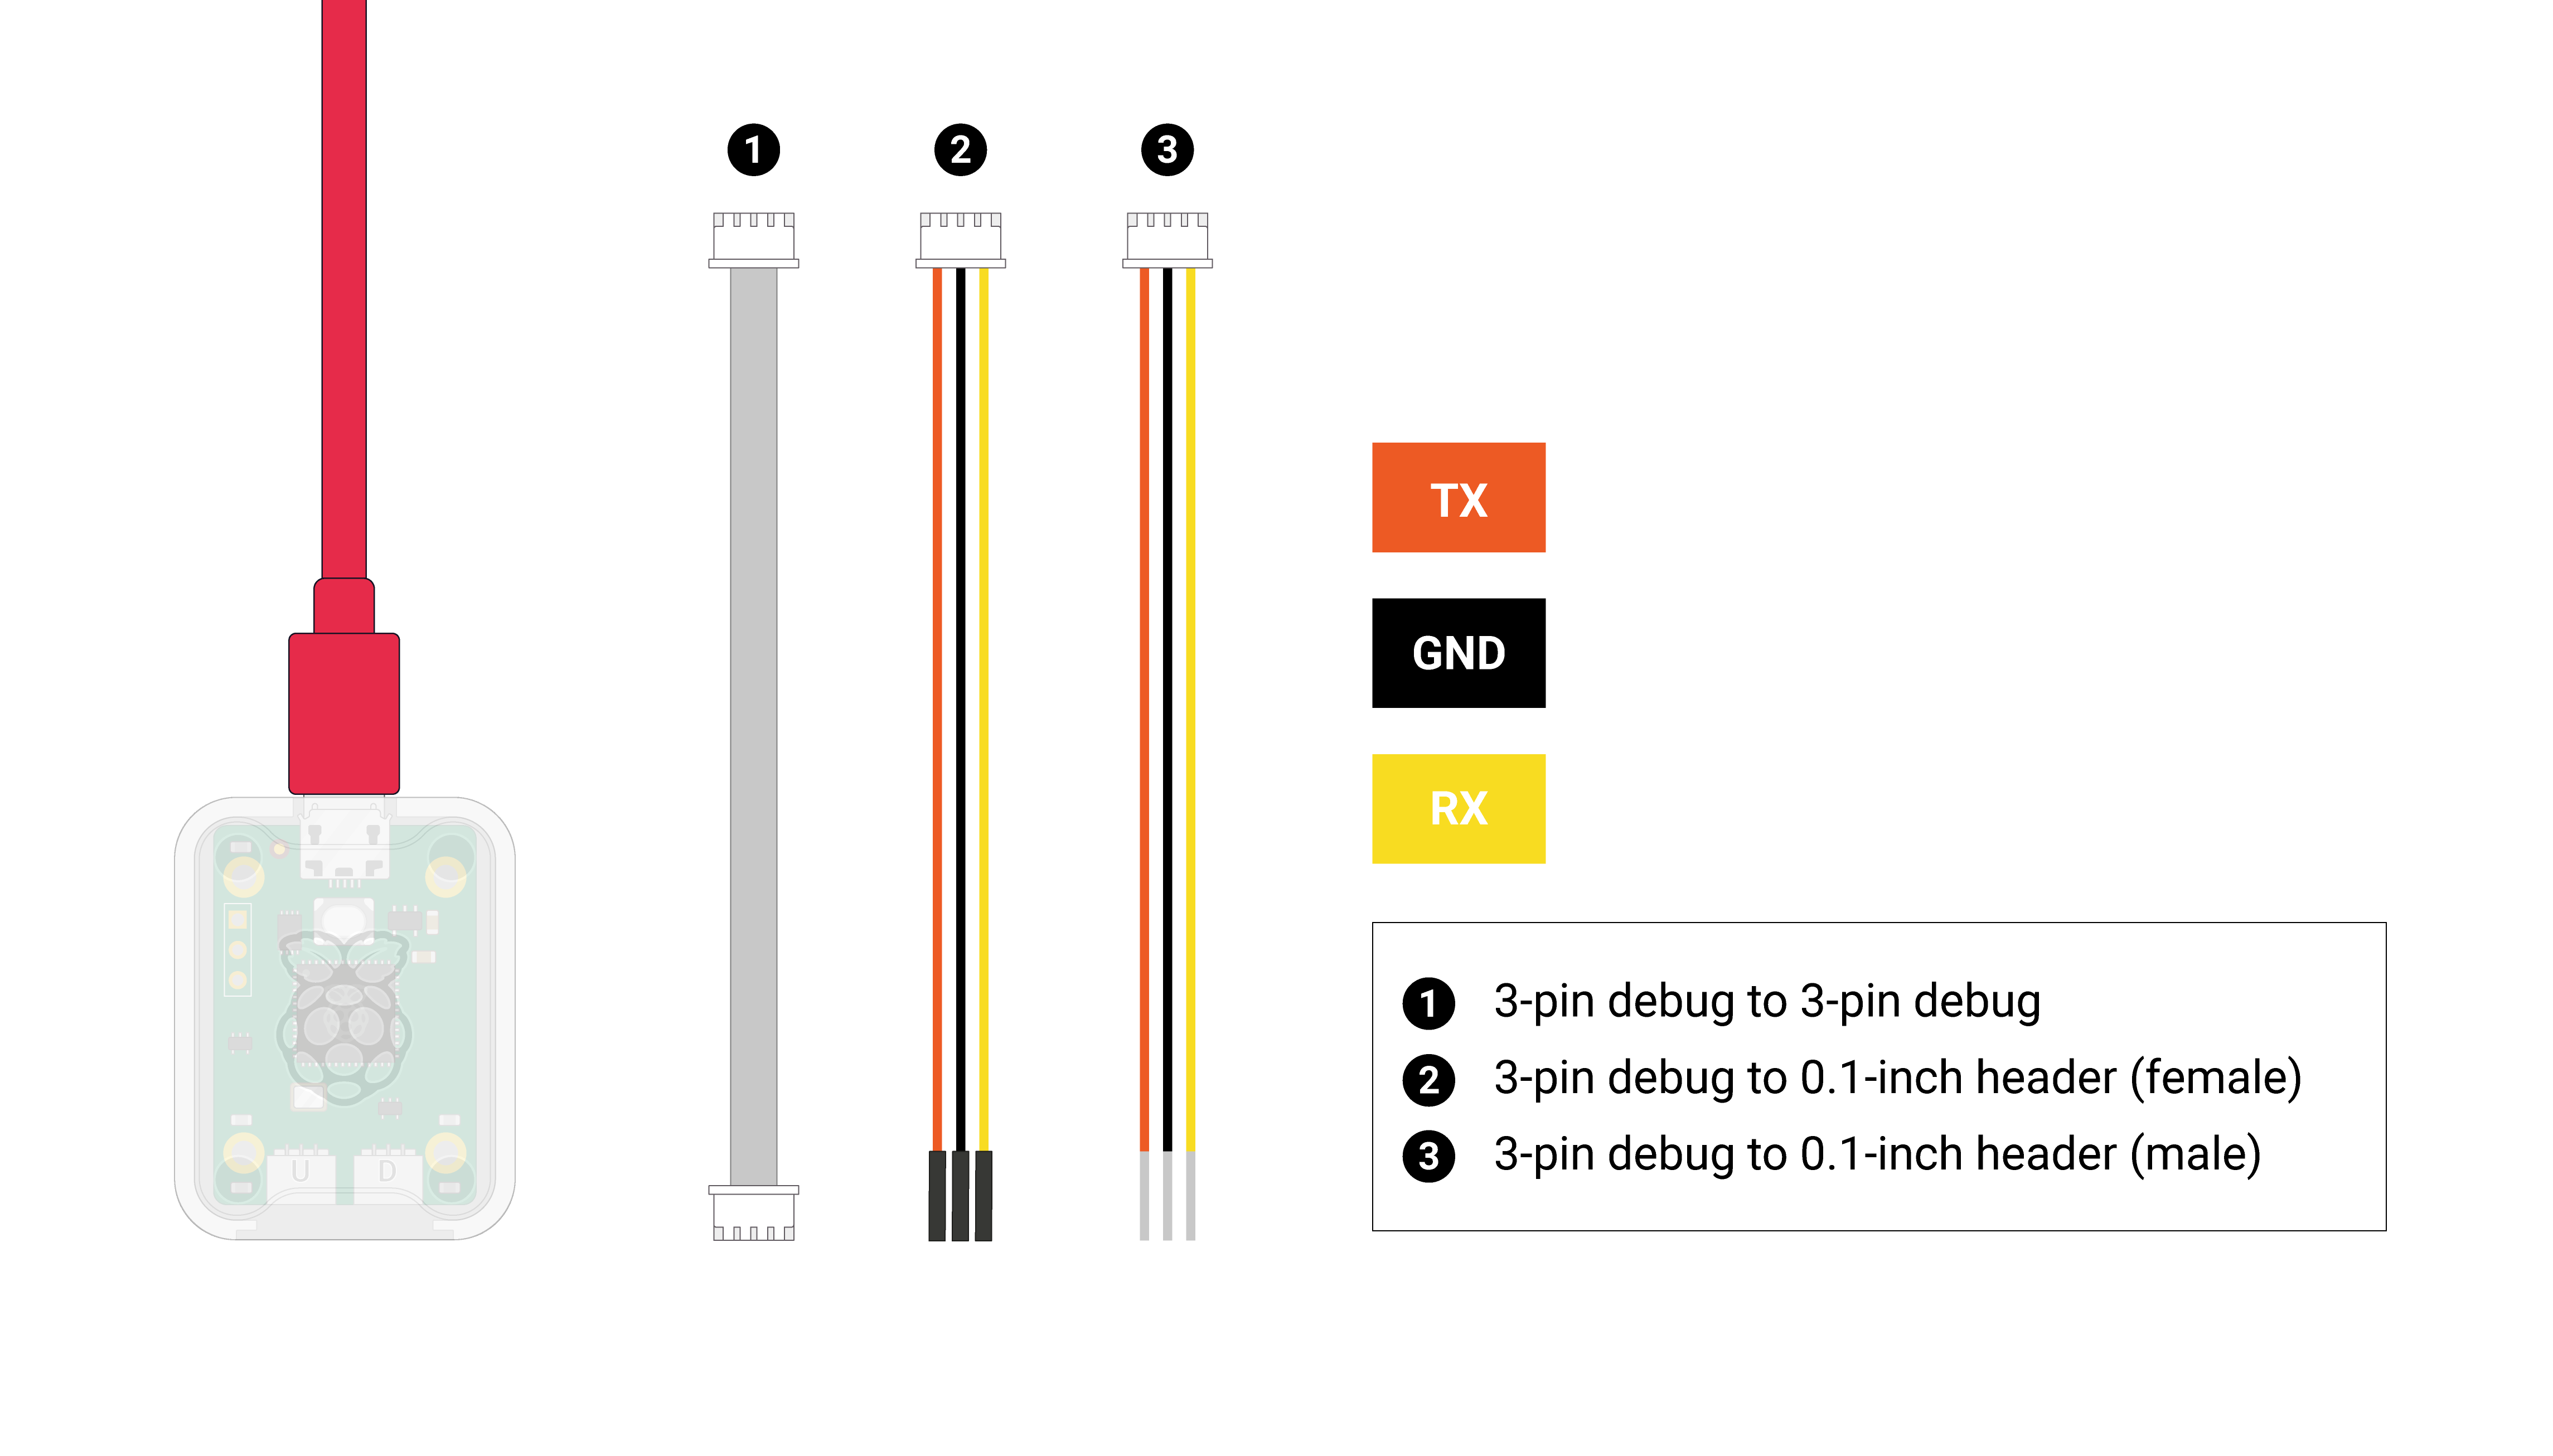
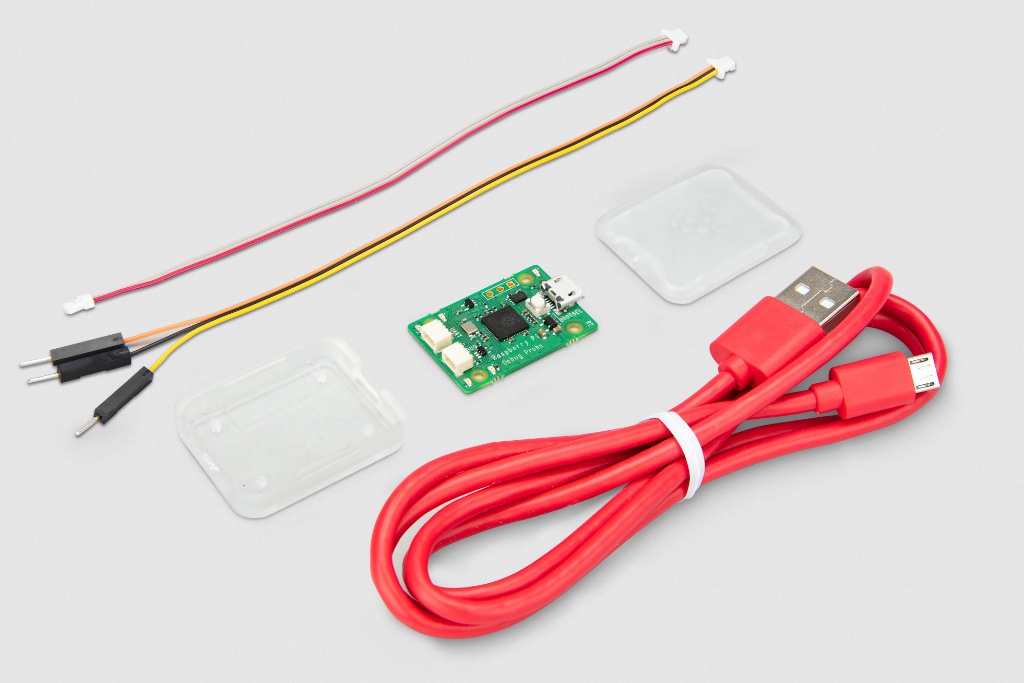
Included with the Debug Probe is a USB power cable and three debug cables:
-
three-pin JST-SH connector to 3-pin JST-SH connector cable
-
three-pin JST-SH connector to 0.1-inch header (female)
-
three-pin JST-SH connector to 0.1-inch header (male)
The two 0.1-inch header cables — intended for breadboard (male) or direct connection to a board with header pins (female) — are coloured as below:
- Orange
-
TX/SC (Output from Probe)
- Black
-
GND
- Yellow
-
RX/SD (Input to Probe or I/O)
While the cable with three-pin JST-SH connectors is intended to be used with the standard three-pin connector which newer Raspberry Pi boards use for the SWD debug port and UART connectors.
The Debug Probe has five LEDs, a red LED to indicate power, and four more activity indicator LEDs
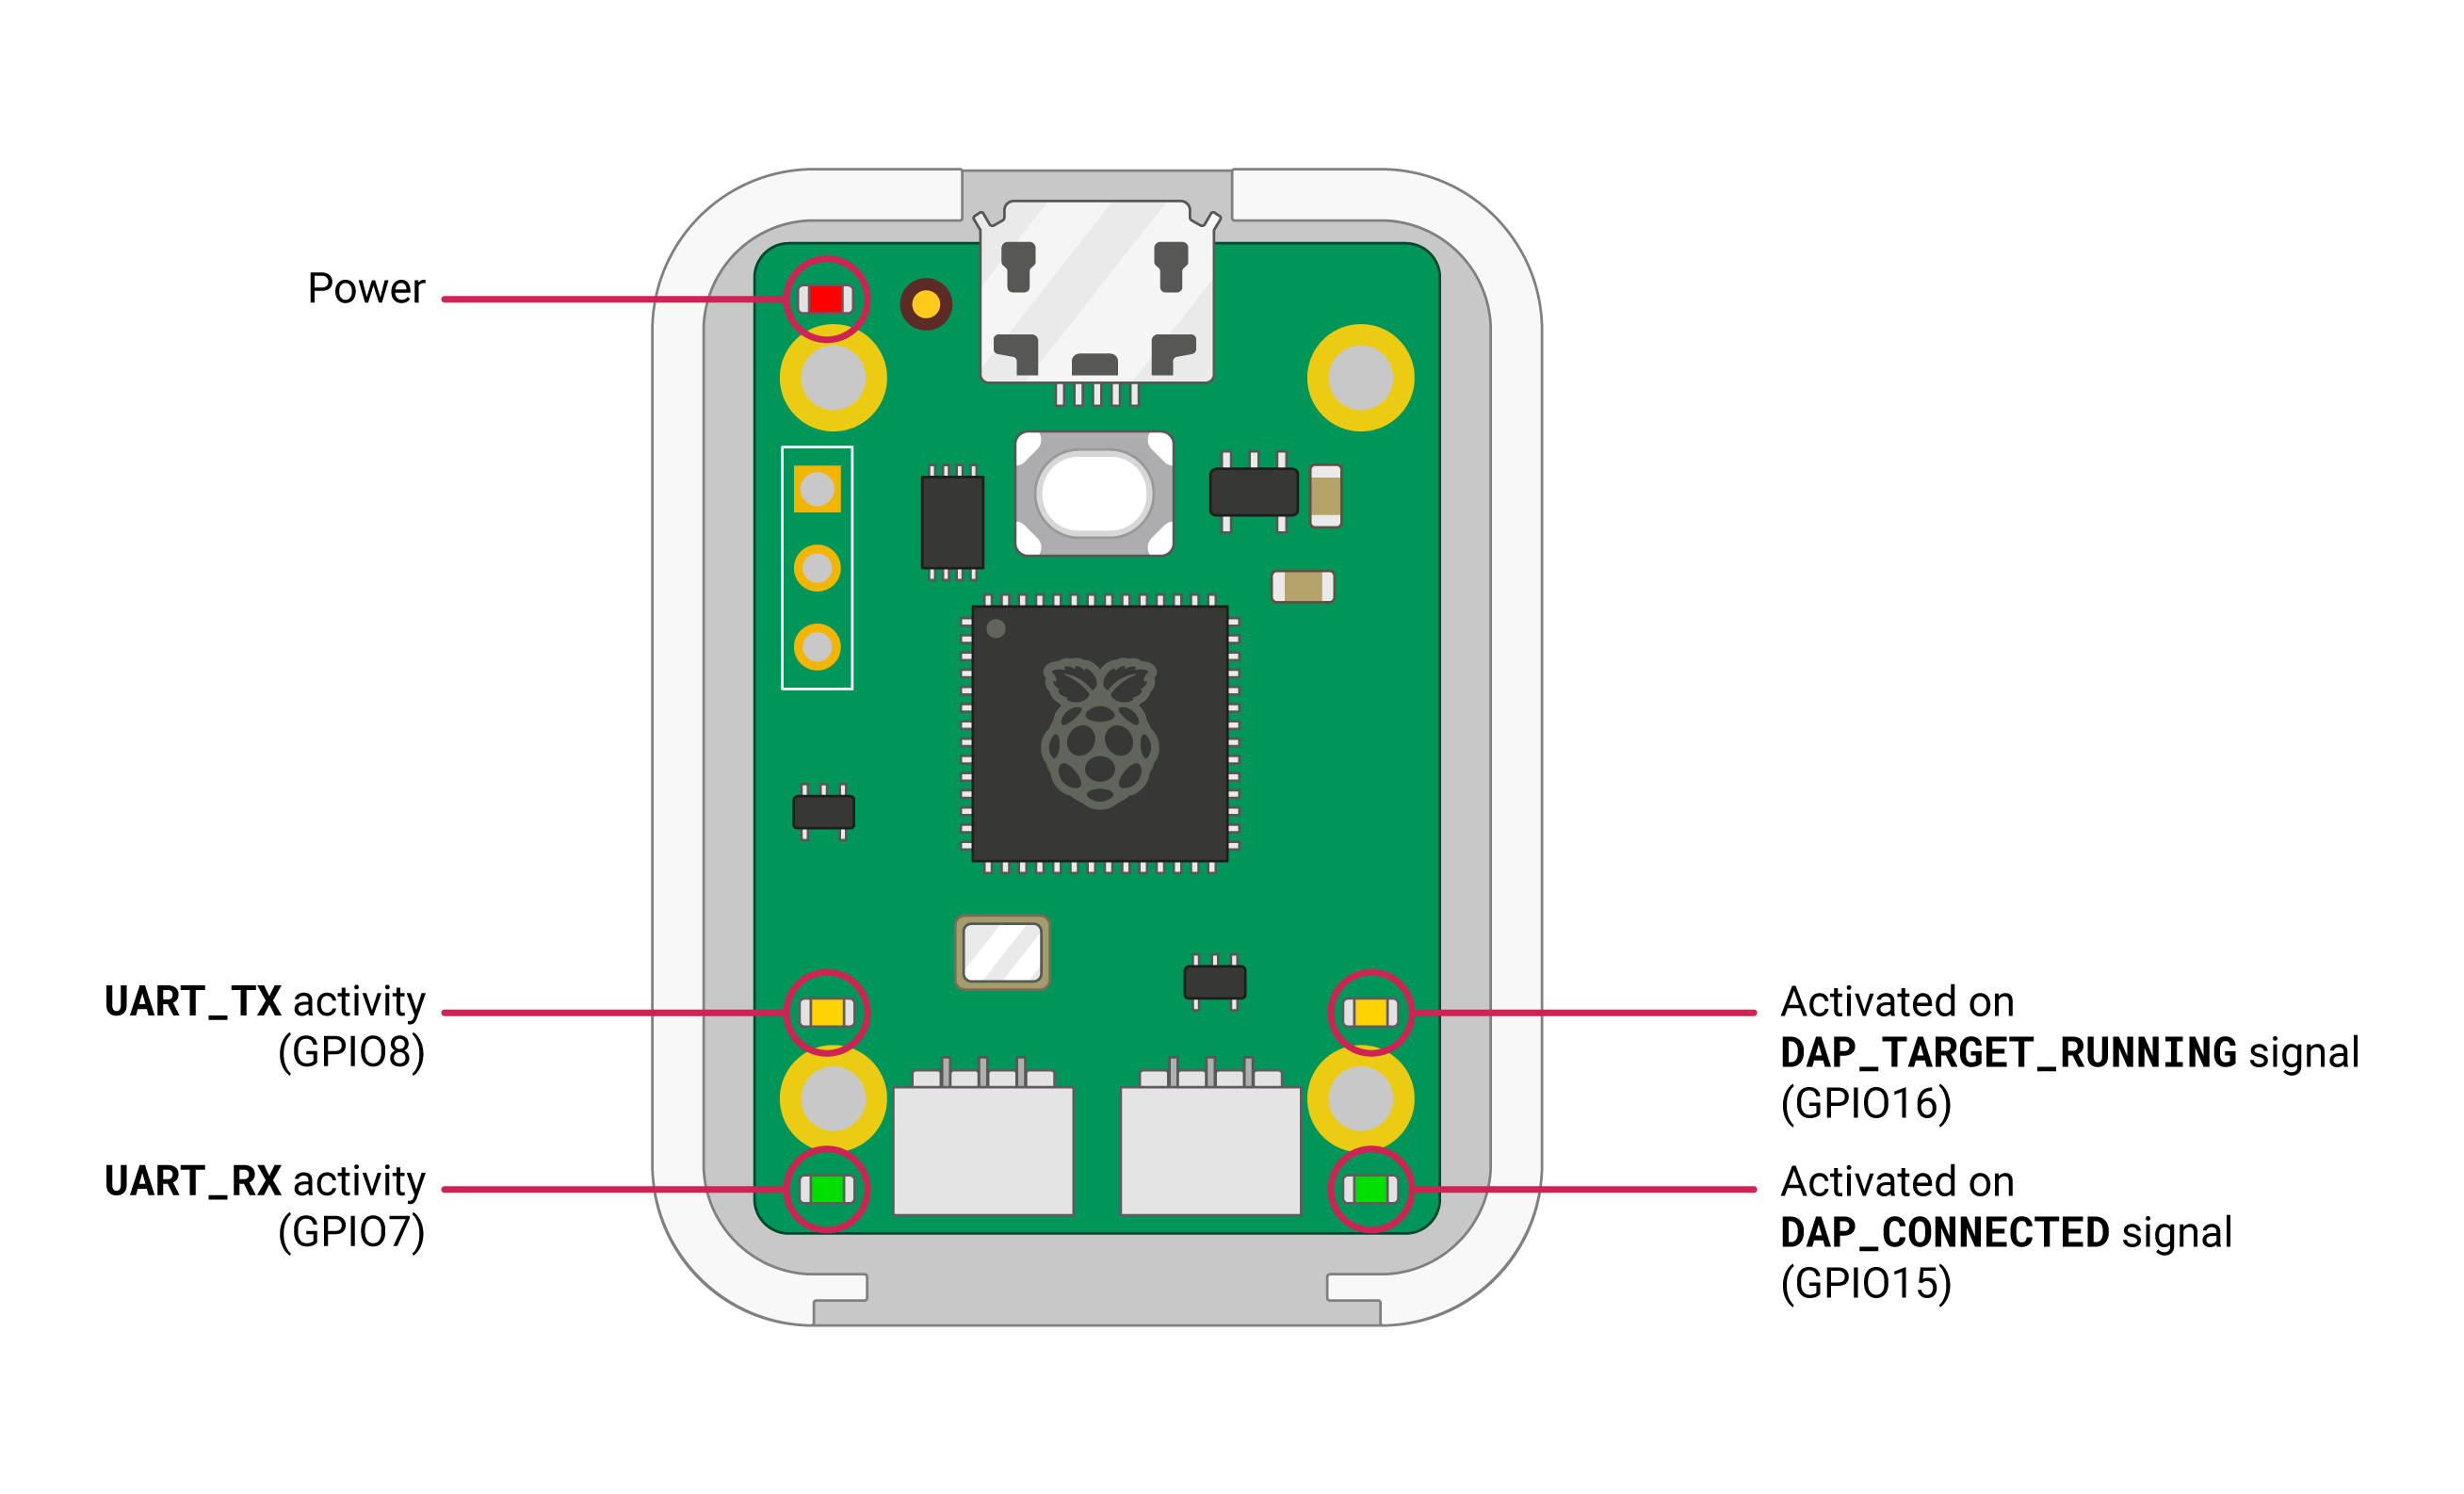
|
Note
|
OpenOCD switches both DAP LEDs on when the target is connected, and turns them off when it calls DAP_DISCONNECT.
|
Getting started
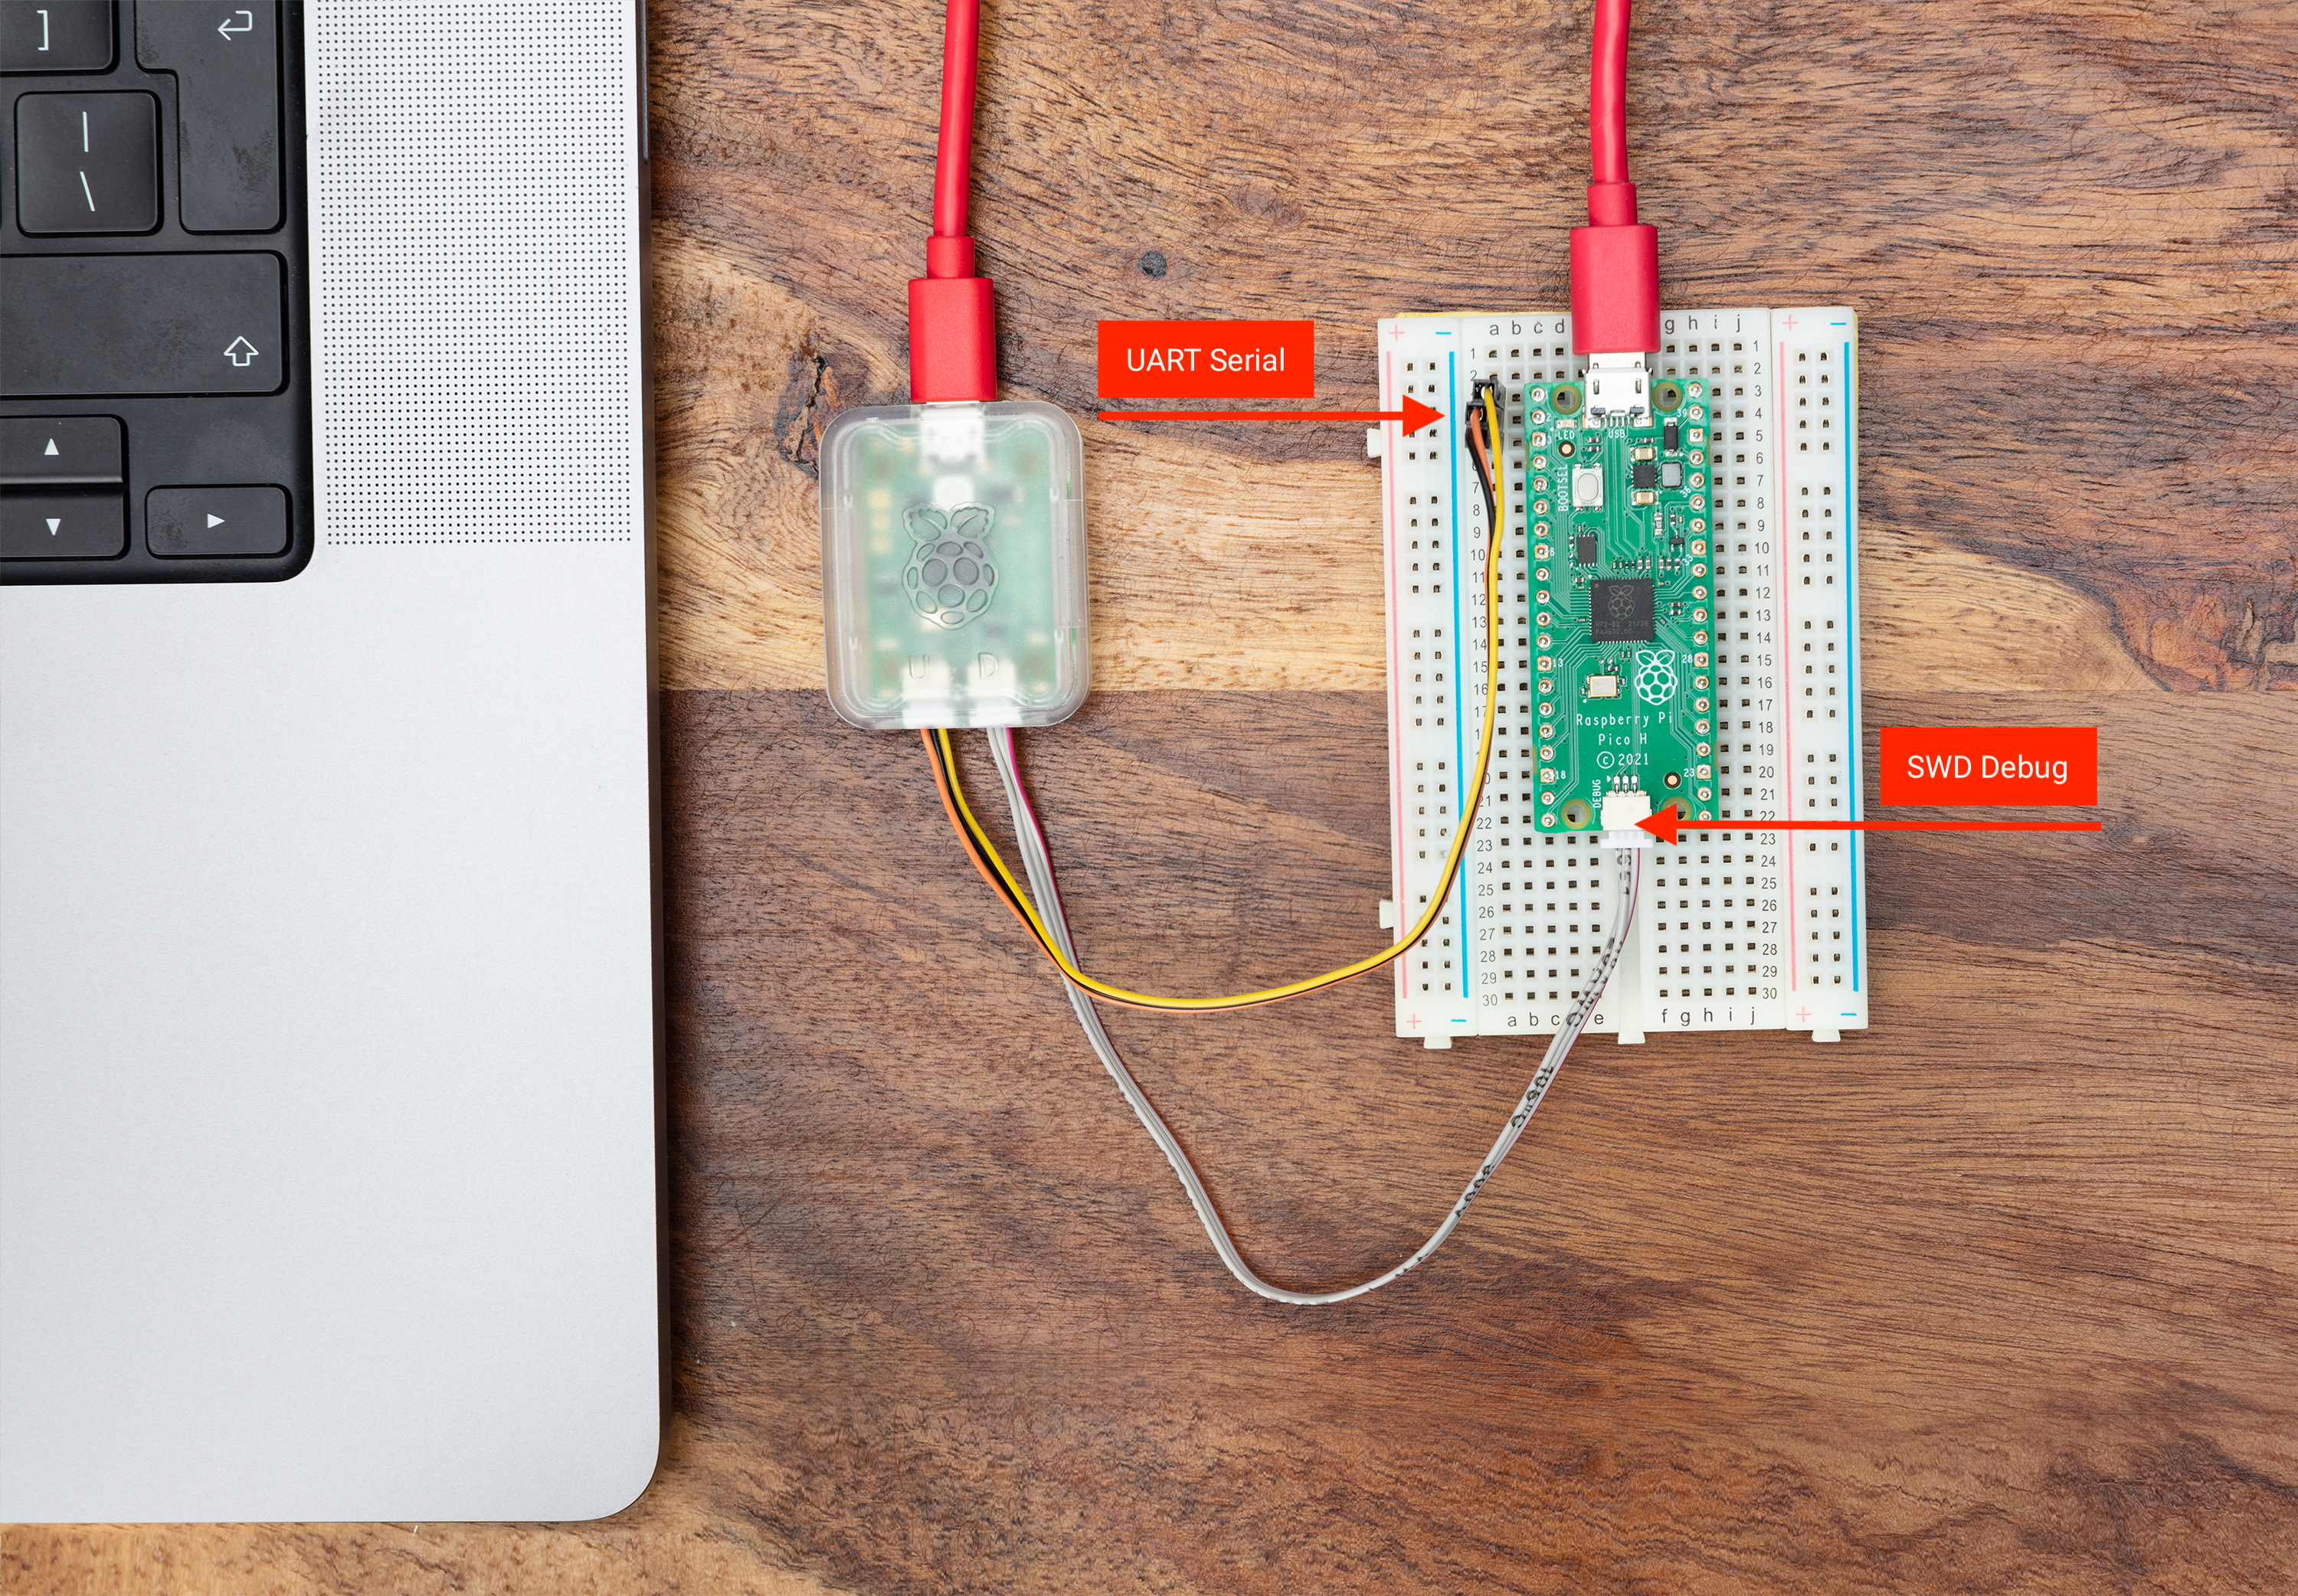
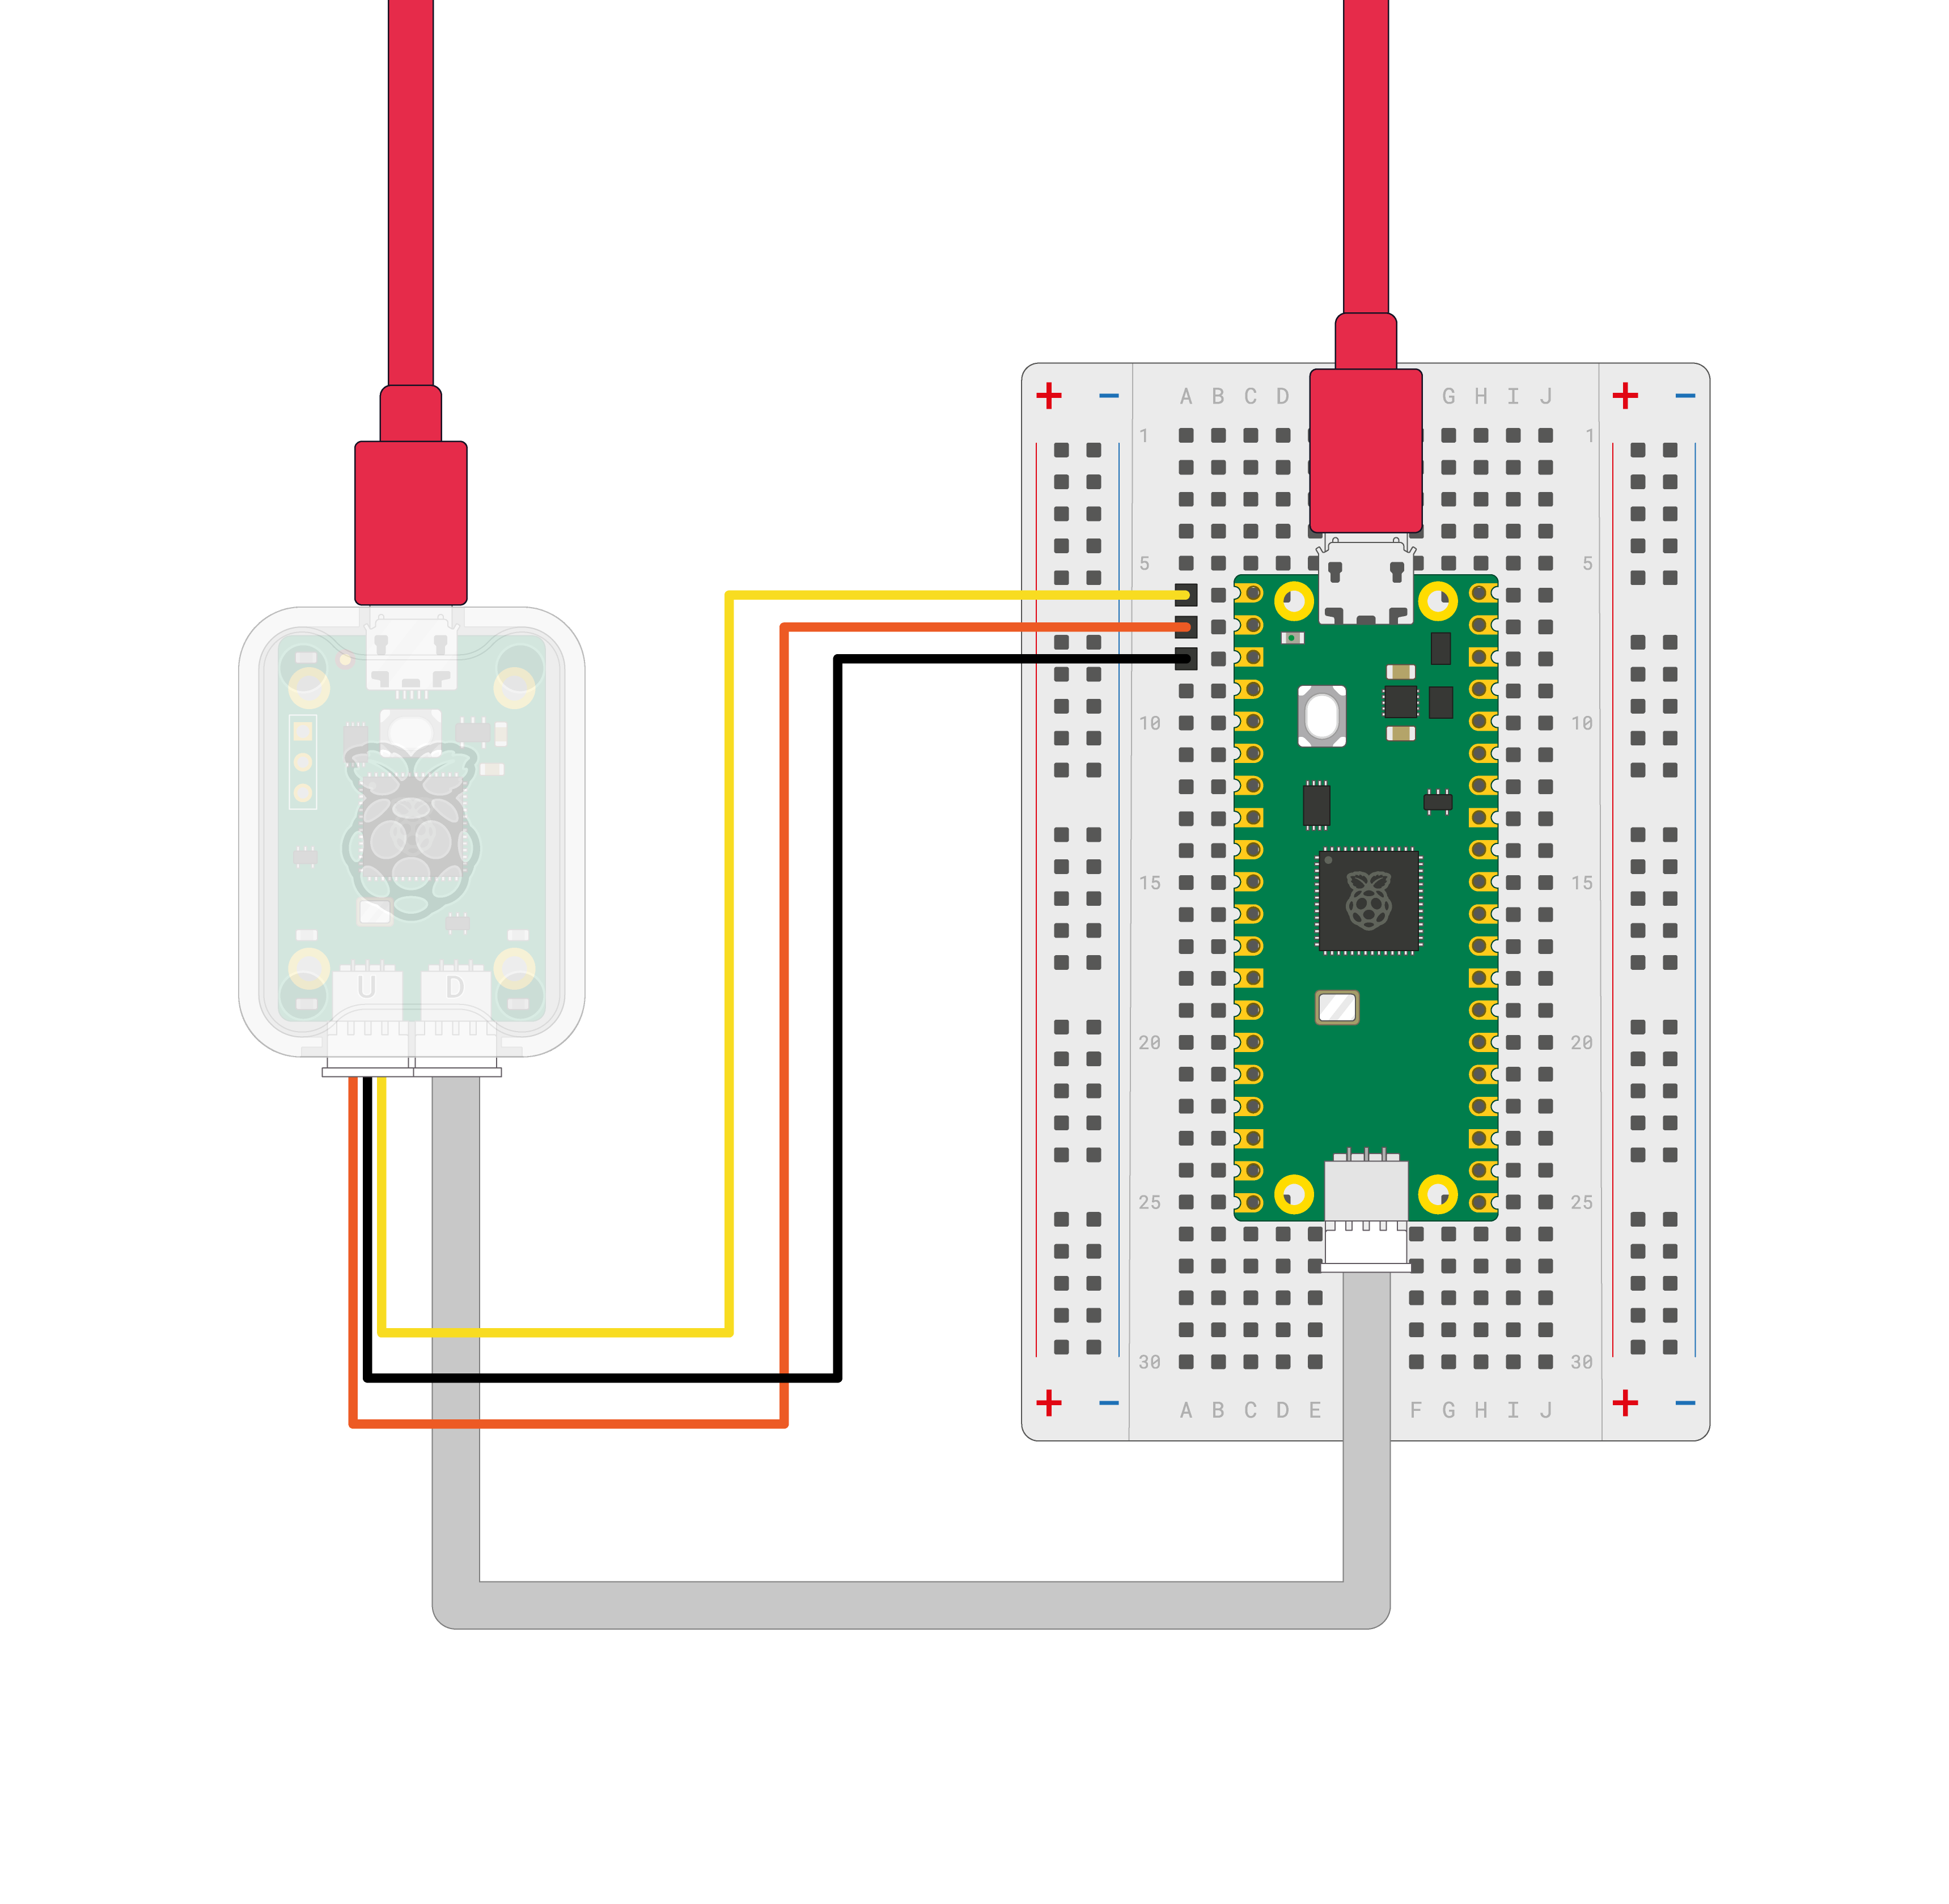
Depending on your setup, there are several ways to wire the Debug Probe to a Pico-series device. Below, we connect the Debug Probe to a Raspberry Pi Pico H which has the newer three-pin JST-SH connector for SWD.
Connect the following:
-
The Debug Probe "D" port to Pico H SWD JST-SH connector
-
The Debug Probe "U" port, with the three-pin JST-SH connector to 0.1-inch header (male):
-
Debug Probe
RXconnected to Pico HTXpin -
Debug Probe
TXconnected to Pico HRXpin -
Debug Probe
GNDconnected to Pico HGNDpin
-
|
Note
|
If you have a non-H Pico or Pico W (without a JST-SH connector) you can still connect it to a Debug Probe. Solder a male connector to the SWCLK, GND, and SWDIO header pins on the board. Using the alternate 3-pin JST-SH connector to 0.1-inch header (female) cable included with the Debug Probe, connect to the Debug Probe "D" port. Connect SWCLK, GND, and SWDIO on the Pico or Pico W to the SC, GND, and SD pins on the Debug Probe, respectively.
|
Install tools
To use the Debug Probe, install the following tools.
Install OpenOCD
You need to install OpenOCD.
To install OpenOCD, run the following command in a terminal:
$ sudo apt install openocdTo run OpenOCD, use the openocd command in your terminal.
Install OpenOCD on macOS
First, install the Homebrew package manager:
$ /bin/bash -c "$(curl -fsSL https://raw.githubusercontent.com/Homebrew/install/master/install.sh)"To install OpenOCD on macOS, run the following commands:
$ brew install openocdTo run OpenOCD, use the openocd command in your terminal.
Install GDB
We also need to install the GNU debugger (GDB).
macOS
Run the following command to install gdb:
$ brew install arm-none-eabi-gdbYou can safely ignore the request for "special privileges" messages on installation.
MS Windows
GDB is available as part of our Pico setup for Windows installer. It is also included in the Arm GNU Toolchain Downloads.
Alternatively information about manual installation can be found in Chapter 9 and Appendix A of our Getting Started with Raspberry Pi Pico book.
|
Note
|
Manual installation of GDB on Windows is not recommended. |
Serial Wire Debug (SWD)
Serial Wire Debug (SWD) is a two-pin interface (SWDIO and SWCLK) alternative to the JTAG four- or five-pin debugging interface standard.
Uploading new programs to your Pico
The Pico Debug Probe will let you load binaries via the SWD port and OpenOCD: you will not need to unplug, and then push-and-hold, the BOOTSEL button every time you push a new binary to your Pico. Using the Debug Probe uploading new binaries is an entirely hands off affair.
Once you have built a binary:
$ sudo openocd -f interface/cmsis-dap.cfg -f target/rp2040.cfg -c "adapter speed 5000" -c "program blink.elf verify reset exit"|
Note
|
When you use the Debug Probe to upload a binary the ELF version of the file is used, not the UF2 file that you would use when you drag-and-drop. |
Debugging with SWD
It’ll also let you use openocd in server mode, and connect GDB, which gives you break points and "proper" debugging.
|
Important
|
To allow debugging, you must build your binaries as $ cd ~/pico/pico-examples/ $ rm -rf build $ mkdir build $ cd build $ export PICO_SDK_PATH=../../pico-sdk $ cmake -DCMAKE_BUILD_TYPE=Debug .. $ cd blink $ make -j4 In a debug build you will get more information when you run it under the debugger, as the compiler builds your program with the information to tell GDB what your program is doing. See Chapter 6 of Getting started with Raspberry Pi Pico for more information. |
To start an OpenOCD server, run the following command:
$ sudo openocd -f interface/cmsis-dap.cfg -f target/rp2040.cfg -c "adapter speed 5000"Then open a second terminal window, switch to the directory containing your built binary, and start a debugger to attach it to the OpenOCD server:
$ gdb blink.elf
> target remote localhost:3333
> monitor reset init
> continue
GDB doesn’t work on all platforms. Use one of the following alternatives instead of gdb, depending on your operating system and device:
-
On Linux devices that are not Raspberry Pis, use
gdb-multiarch. -
On macOS devices, use
arm-none-eabi-gdb.
Serial connections
Ensure that the Debug Probe is connected to the UART pins of your Raspberry Pi Pico.
The default pins for Raspberry Pi Pico UART0 are as follows:
| Default UART0 | Physical Pin | GPIO Pin |
|---|---|---|
GND |
3 |
N/A |
UART0_TX |
1 |
GP0 |
UART0_RX |
2 |
GP1 |
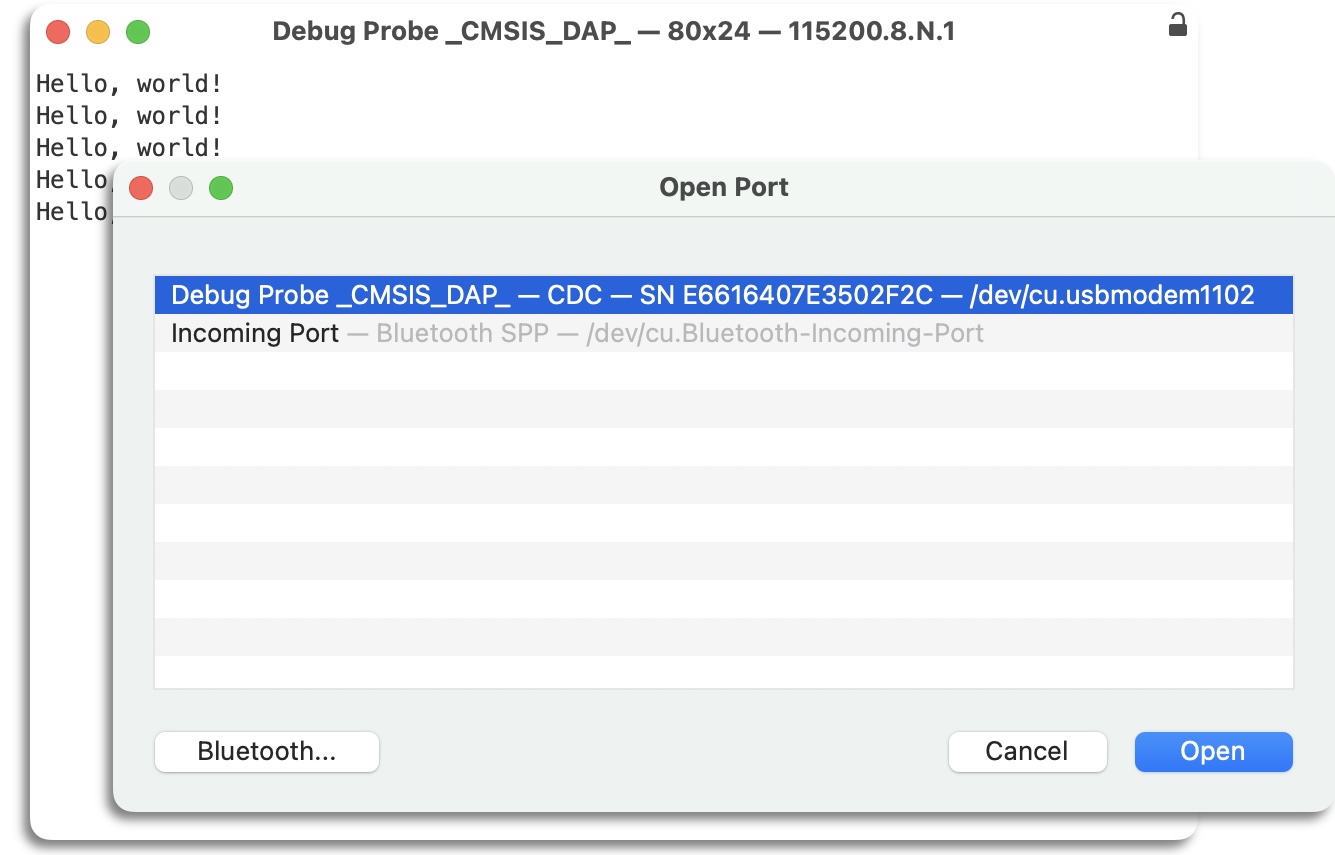
Once connected, traffic over the Raspberry Pi Pico’s UART will be relayed to your computer by the Debug Probe and exposed as a CDC UART. On a Raspberry Pi this will show up as /dev/ttyACM0; on other platforms this serial port will show up differently (e.g. on macOS it will appear as /dev/cu.usbmodemXXXX).
If you have not already done so you should install minicom:
$ sudo apt install minicomand open the serial port:
$ minicom -b 115200 -o -D /dev/ttyACM0|
Tip
|
To exit minicom, use CTRL-A followed by X.
|
To test serial communication you can build and upload the "Hello World" example application.
Change directory into the hello_world directory inside the pico-examples tree, and run make. Afterwards, you can upload it to your Raspberry Pi Pico using openocd. For a full walkthrough of building the hello_serial example program, see Chapter 4 of Getting started with Raspberry Pi Pico.
$ cd pico-examples
$ mkdir build
$ cd build
$ export PICO_SDK_PATH=../../pico-sdk
$ cmake ..
$ cd hello_world/serial
$ make -j4
$ sudo openocd -f interface/cmsis-dap.cfg -f target/rp2040.cfg -c "adapter speed 5000" -c "program hello_serial.elf verify reset exit"
$ minicom -b 115200 -o -D /dev/ttyACM0
On opening minicom you should see "Hello, world!" printed to the console.
For terminal programs that support it, a description of the USB serial UART is advertised in the USB device description.
The unique serial number in this description means that on Windows your COM port numbering is "sticky" per device, and will allow you to write udev rules to associate a named device node with a particular Debug Probe.
Updating the firmware on the Debug Probe
Firmware for the Debug Probe is available as a UF2 file distributed by Raspberry Pi.
The latest version of the Debug Probe firmware is version 2.2. If you’re running an older version, or if you have accidentally overwritten the firmware on your Debug Probe, you can find the latest release of the firmware in the debugprobe GitHub repository.
Download debugprobe.uf2 from the latest release.
Pinch to remove the top of the Debug Probe enclosure.
Push and hold the BOOTSEL button as you plug the Debug Probe into your computer to mount a volume called "RPI-RP2".
Copy debugprobe.uf2 onto the "RPI-RP2" volume. The volume will dismount automatically after the file finishes copying onto the device.
Your Debug Probe will reboot and now runs an updated version of the Debug Probe firmware. It is now ready for debugging.
Schematics
Schematics and mechanical drawing of the Debug Probe are available:
-
Schematics (PDF)
-
Mechanical Diagram (PDF)
The test point (TP) shown on the schematics are located as shown in the diagram below.
